
INTRODUCTION
Facial aesthetics is receiving ever increasing attention in orthodontics. Wahl wrote, “Now it appears that facial aesthetics is again in the fore front as we realize why patients come to us in the first place”.1 The normal human face is possibly the most beautifully perfect structure in all of the animal kingdom.2 The human face holds anabsorbing and consuming interest for people the world over. Our faces unquestionably influence and mould our character, personality, and behaviour. Orthodontics is a combination of both art and
science, and facial aesthetics is the reflection of the orthodontist’s artistic intuition. Facial features have been evaluated with anthropometric, photogrammetric and cephalometricmeasurements.3-7. Because the standards of beauty could vary considerably among persons as well asracial groups, it is essential for a clinician to develop the concept of normal for a particular racial group.8, 9 Hence, the present study was undertaken to evaluate the photogrammetric norms in cranio-facialregion, which will prove useful to orthodontists, maxillo-facial and plastic surgeons.
AIMS AND OBJECTIVES
In the present cross-sectional study, the aim wasto:
-
To analyze various facial measurements inlocal Hyderabad population and establishphotogrammetric norms.
-
To compare male and female norms ofHyderabad population.
-
To compare these norms with the norms ofother ethnic groups.
-
To derive clinical implications which willbe useful to Orthodontists, Oral andMaxillofacial and Plastic Surgeons.
MATERIALS & METHODS
The material consisted frontal and lateralphotographs of 80 young adults (40 females, meanage 21.15 years; 40 males, mean age 21.55 years) ofnative Hyderabad population. The inclusion criteriawere age between 18 and 25 years, Acceptable, pleasing profiles with Class I molar relationship onboth the sides, with normal over jet and overbite, not wearing glasses. No dental or facial trauma, andno congenital defects. All the subjects had completedtheir active physical growth. No history of previousOrthodontic or Prosthodontic treatment or facialsurgery. The sample included both male and femalesexes in equal numbers to evaluate the significantmorphological differences between them.
Photographic set up
The method described by Riverio et al (2003)for the photographic set up and record taking wasused.10 The photographic setup consisted of a tripodthat held a 35-mm camera with a 100-mm macrolens and a primary flash. For illumination duringphotography, umbrella flashes were used. The 100mm macro lens was chosen to avoid facialdeformations. The stability of the elements and theeasy adjustment of the tripod height allowed us tokeep the optic axis of the lens horizontal during therecording. Levelling devices at the base of the tripodand on the camera controlled its correct horizontalposition. The camera was used in its manualposition, the shutter speed was 1/125 second, andthe opening of the diaphragm was f/11. Camera tosubject distance was standardized at 1.5 meters.
Patient Positioning
A portable cephalostat was specifically confectedfor the present study and consisted of a metalstructure with an acrylic part to which the ear rodswere attached. These structures were adjustable inthe vertical direction for the correct adaptation tothe patient’s ears. The photographs were obtainedin both frontal and profile views. For the profile view, the subject was instructed to sit on an adjustablestool in front of the mirror which was placedapproximately 110 cm from subject, with his/her feeta short distance apart, back straight and lookinginto his/ her eyes in themirror. Once the patientremained stable in the NHP, the ear rods wereinserted with light skin contact.11 For frontalphotographs, the subject was asked to look directlyat the camera in a relaxed manner. The camerashould be about at the height of the middle of theface and in portrait format.12
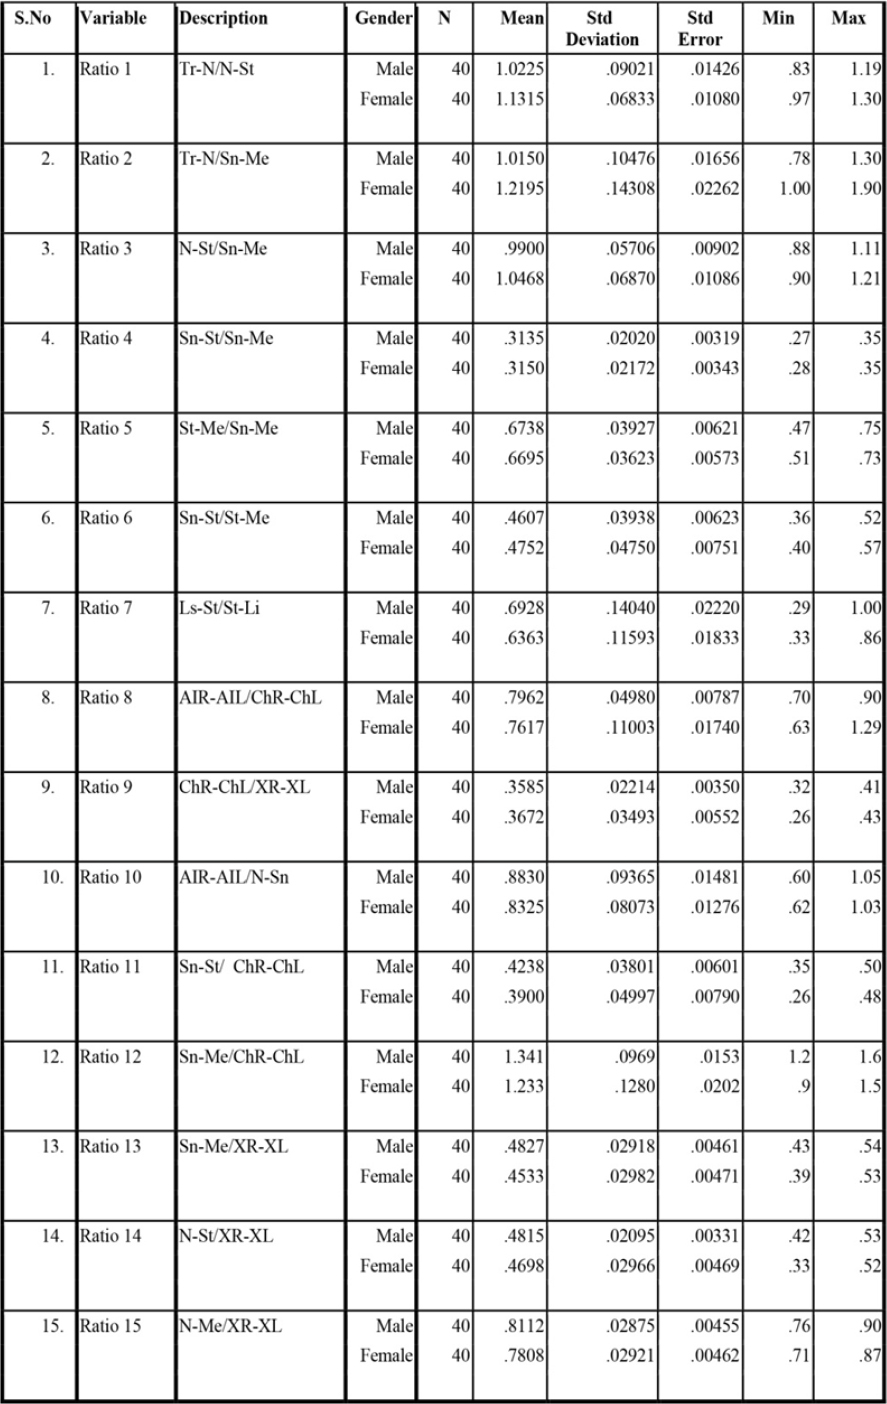
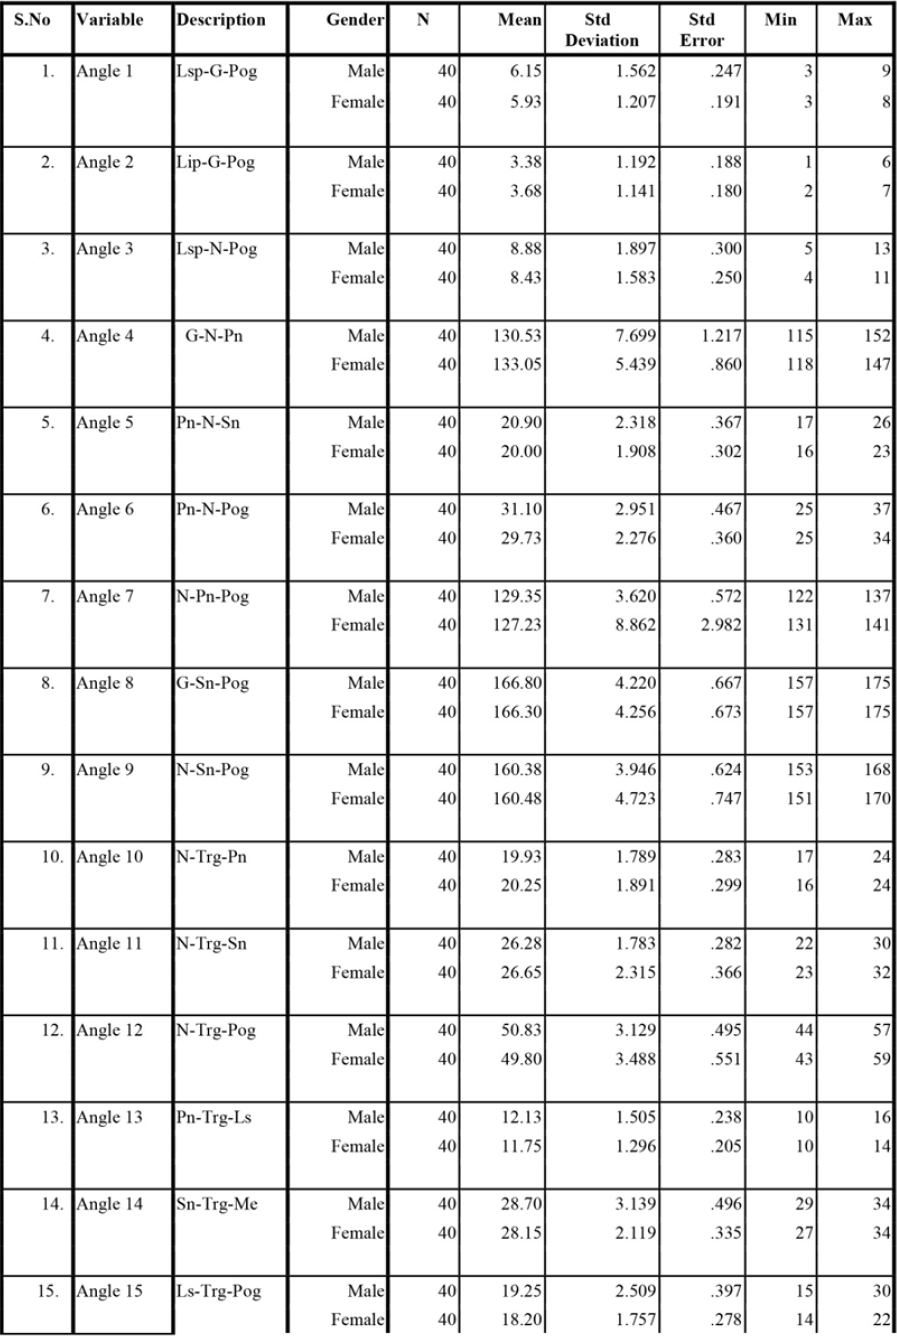
The photographic analysis was carried out onthe computer using AutoCAD 2012 software. On thefrontal photographs, 12 landmarks and, on thelateral photographs, 10 landmarks were selected.13Fifteen ratios (indices) that express size independentfacial proportions are calculated on frontalphotographs. Fifteen angular measurements werecalculated on the lateral photographs and 15Proportional Indices were Investigated on frontalphotographs (Table 1 and 2).
|
Table 1: Descriptive Statistics for 15 Investigated Ratios on Frontal photographs
Click here to view |
|
Table 2: Descriptive Statistics for 15 Investigated Angels on Lateral photographs
Click here to view |
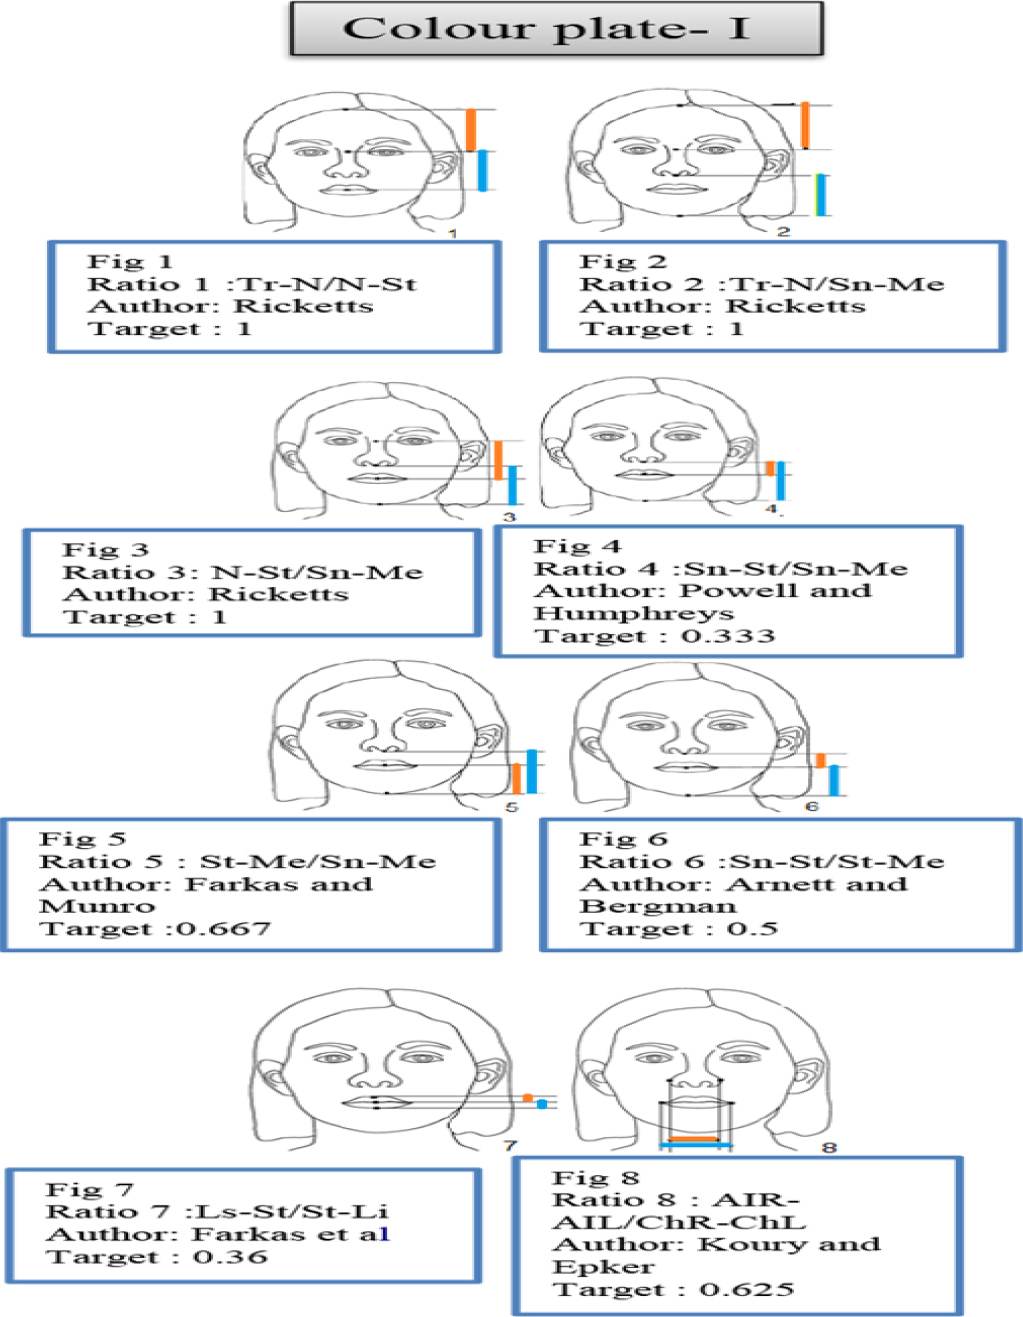
Ratio 1: Tr-N/N-St, ratio between height offorehead and upper face.
Ratio 2: Tr-N/Sn-Me, ratio between height offorehead and lower face.
Ratio 3: N-St/Sn-Me, ratio between upper face andlower face height.
Ratio 4: Sn-St/Sn-Me, ratio between upper lip andlower face height.
Ratio 5: St-Me/Sn-Me, ratio between lower lip andlower face height.
Ratio 6: Sn-St/St-Me, ratio between upper andlower lip length.
Ratio 7: Ls-St/St-Li, Vermilion Height Index.
Ratio 8: AIR-AIL/ChR-ChL, Nose-Mouth widthIndex.
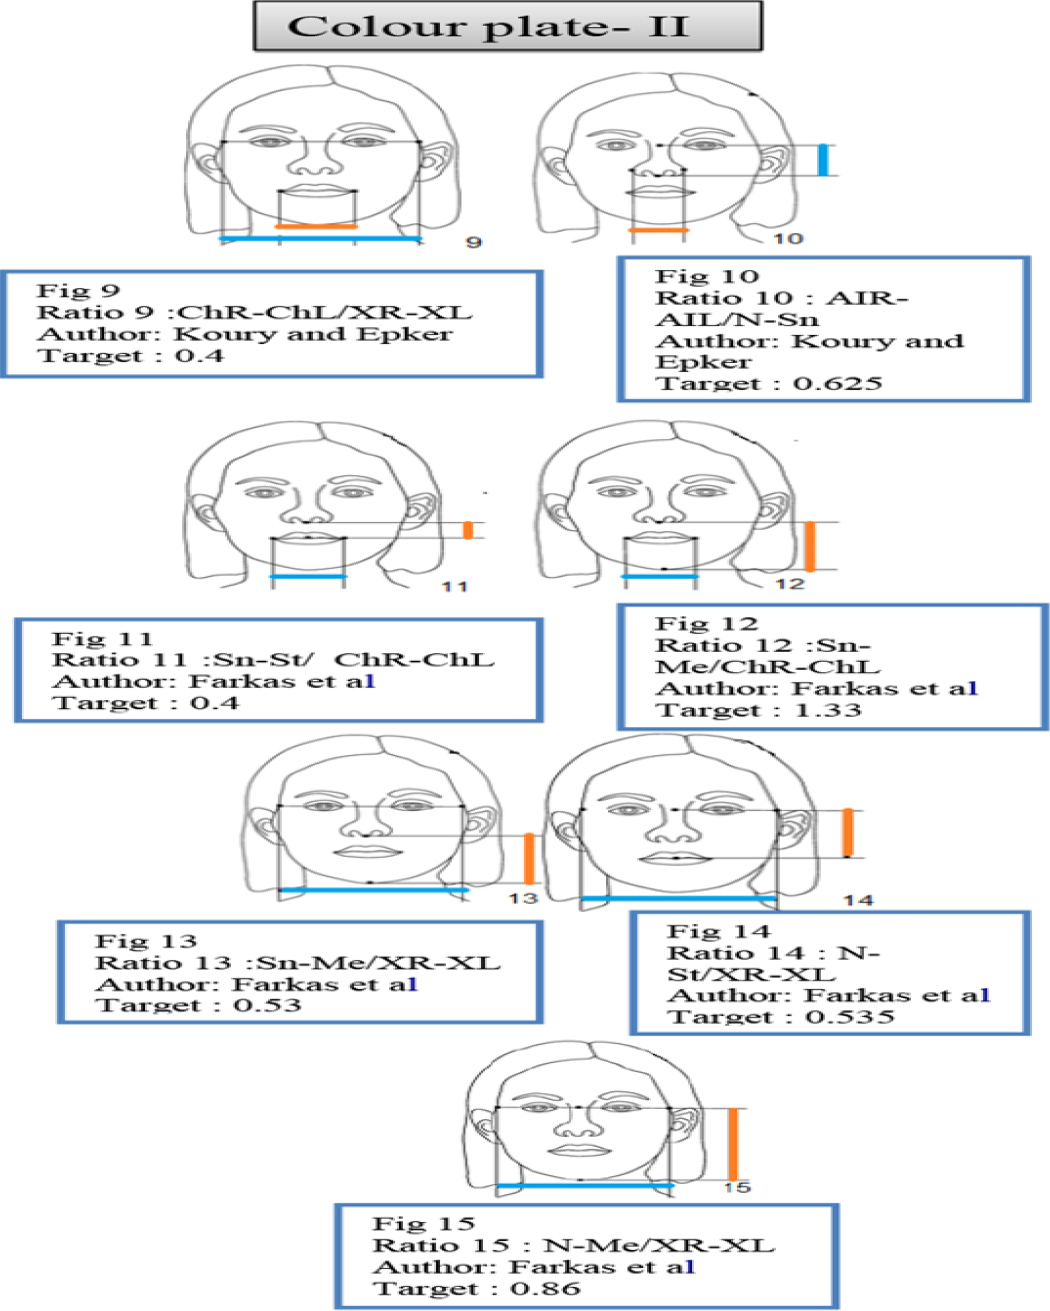
Ratio 9: ChR-ChL/XR-XL, Mouth- face widthIndex.
Ratio 10: AIR-AIL/ N-Sn, Nasal Index.
Ratio 11: Sn-St/ChR-ChL, Upper lip length-Mouthwidth Index.
Ratio 12: Sn-Me/ChR-ChL, Lower face height-Mouth width Index.
Ratio 13: Sn-Me/XR-XL, Lower face Index.
Ratio 14: N-St/XR-XL, Upper face Index.
Ratio 15: N-Me/XR-XL, Facial Index.
Investigated 15 Angles on Lateral photographs
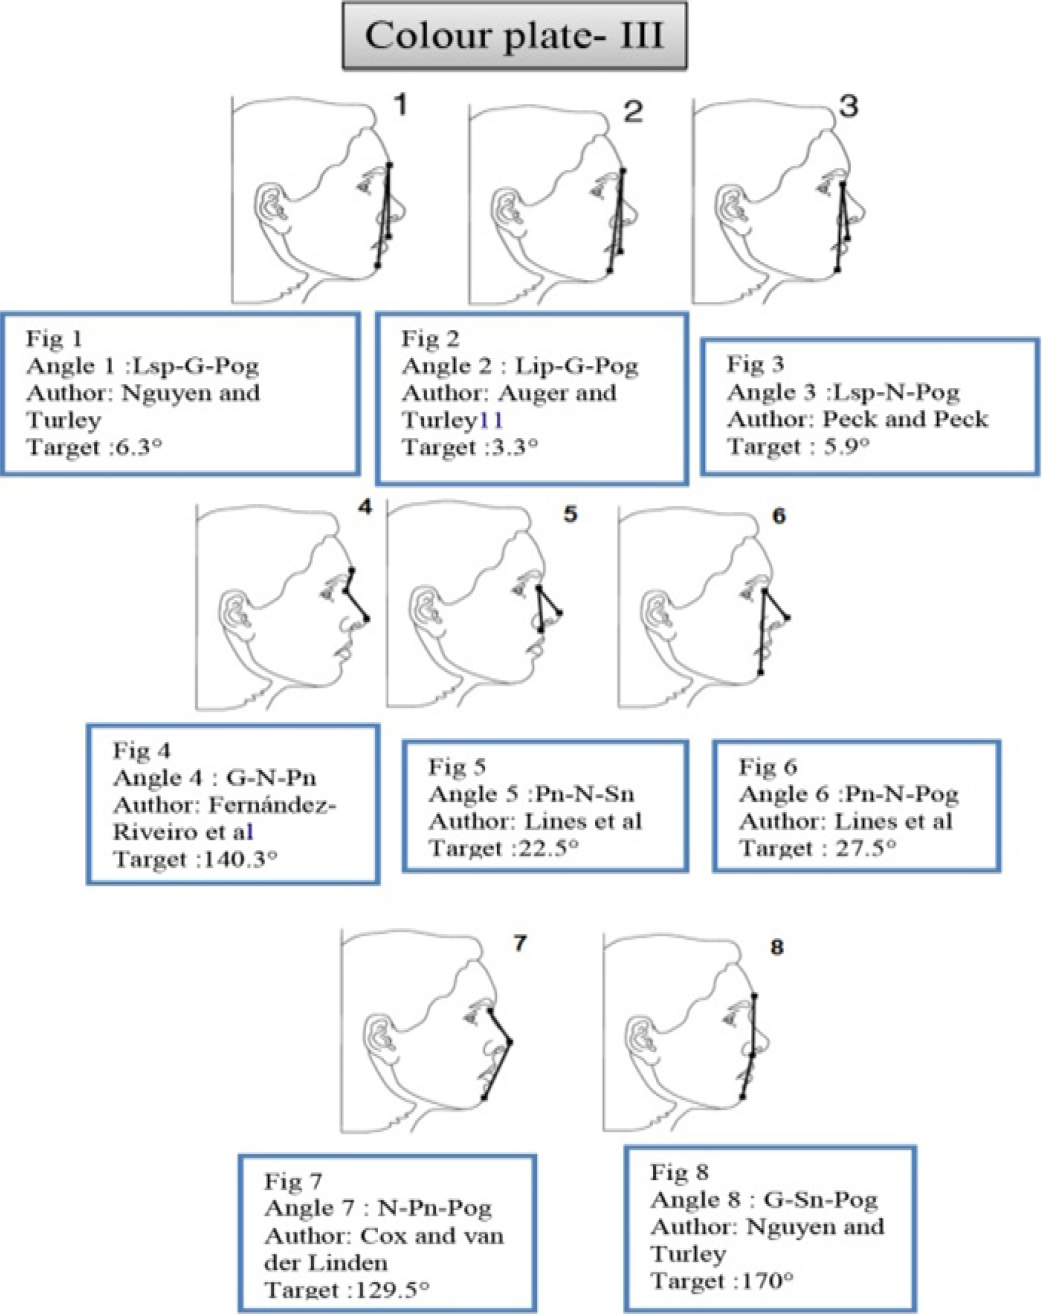
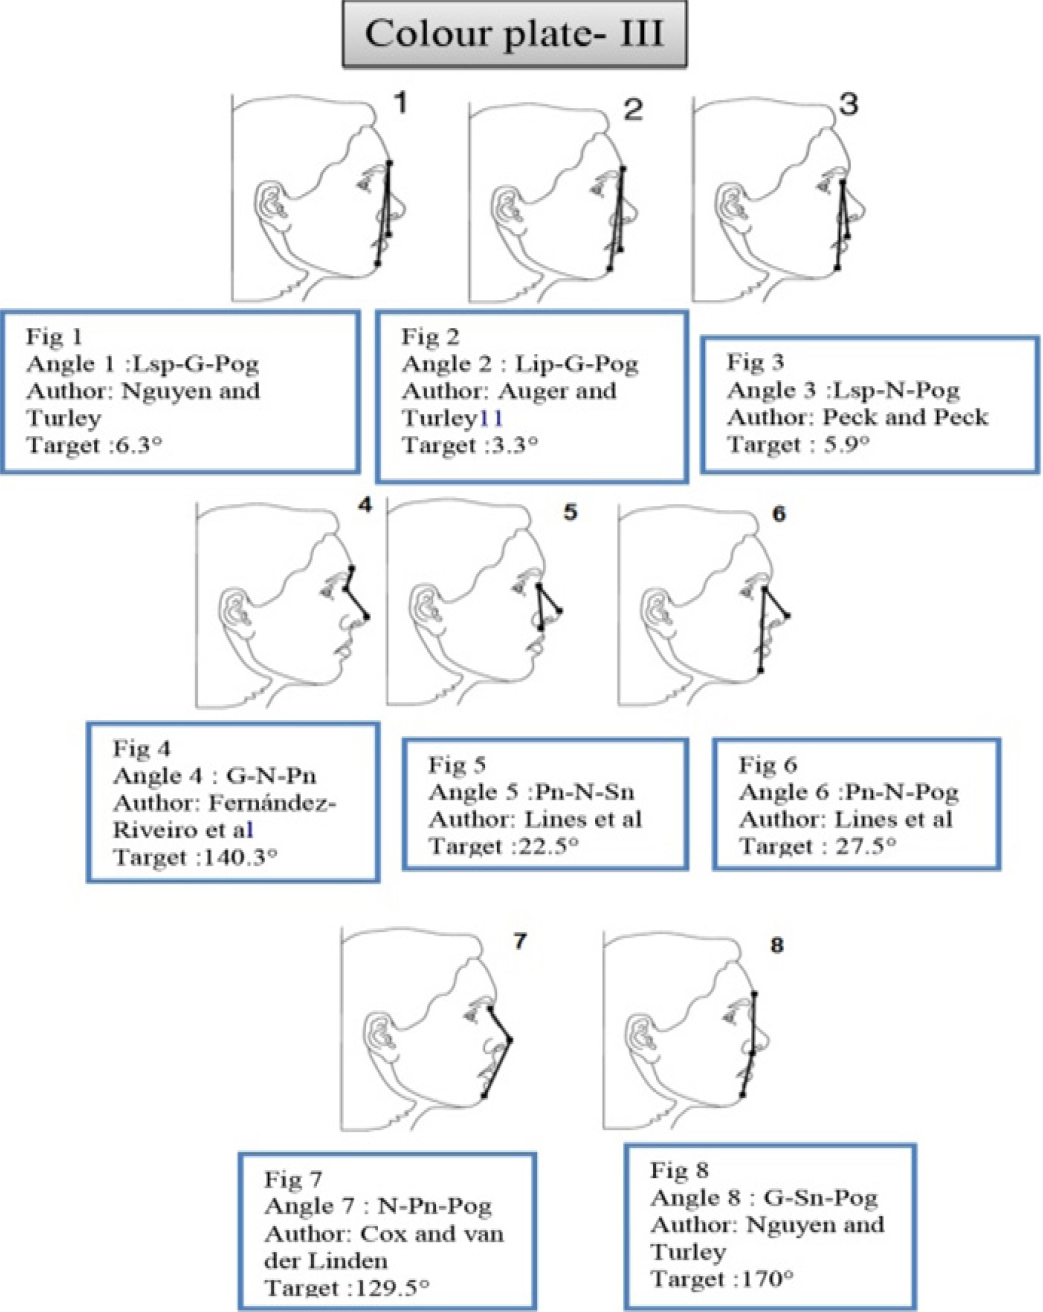
Angle 1: Lsp-G-Pog; Upper lip projection.
Angle 2: Lip-G-Pog; Lower lip projection.
Angle 3: Lsp-N-Pog; Maxillofacial angle.
Angle 4: G-N-Prn; Nasofrontal angle.
Angle 5: Prn-N-Sn; Columella length angle.
Angle 6: Prn-S-Pog; Nasal prominence angle.
Angle 7: N-Prn-Pog.
Angle 8: G-Sn-Pog; Angle of facial convexity.
Angle 9: N-Sn-Pog.
Angle 10: N-Trg-Prn; Nasal angle.
Angle 11: N-Trg-Sn; Angle of medium facial third.
Angle 12: N-Trg-Pog; Total vertical angle.
Angle 13: N-Trg-Ls.
Angle 14: Sn-Trg-Me; Angle of inferior facial third.
Angle 15: Ls-Trg-Pog: Mandibular angle.
Statistical analysis
The measurements were statistically analyzedby calculating their mean and standard deviationfor both groups. A comparison was also madebetween males and females with the help ofStudent’s unpaired ’t’ test, then the means ofHyderabad population were compared with meansof Caucasian population with the help of One-Sample t’ test.
RESULTS
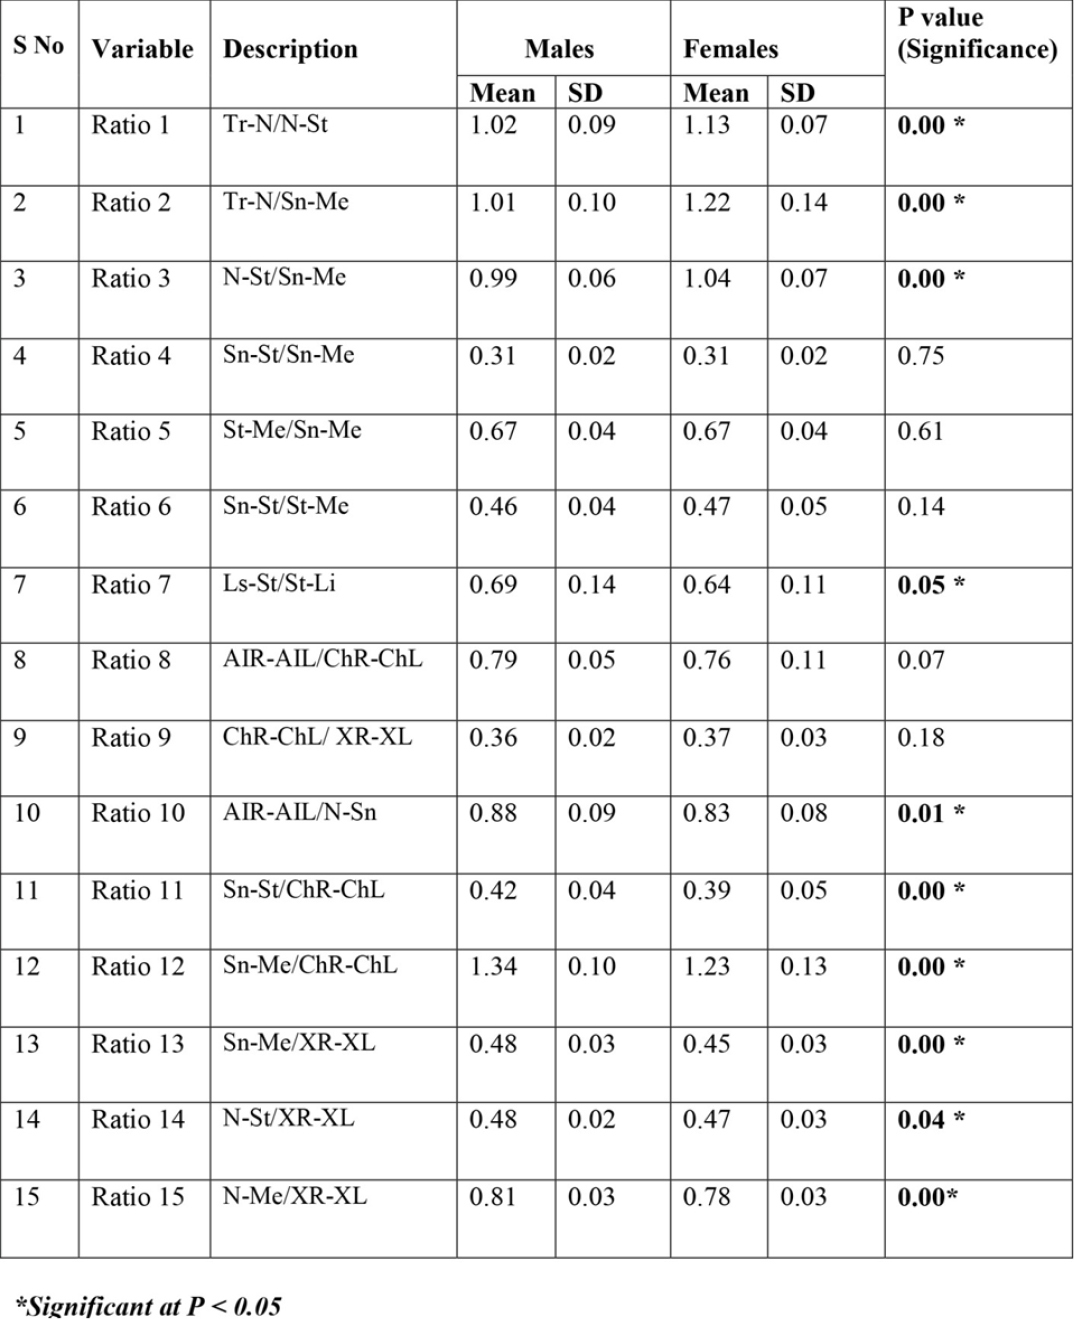
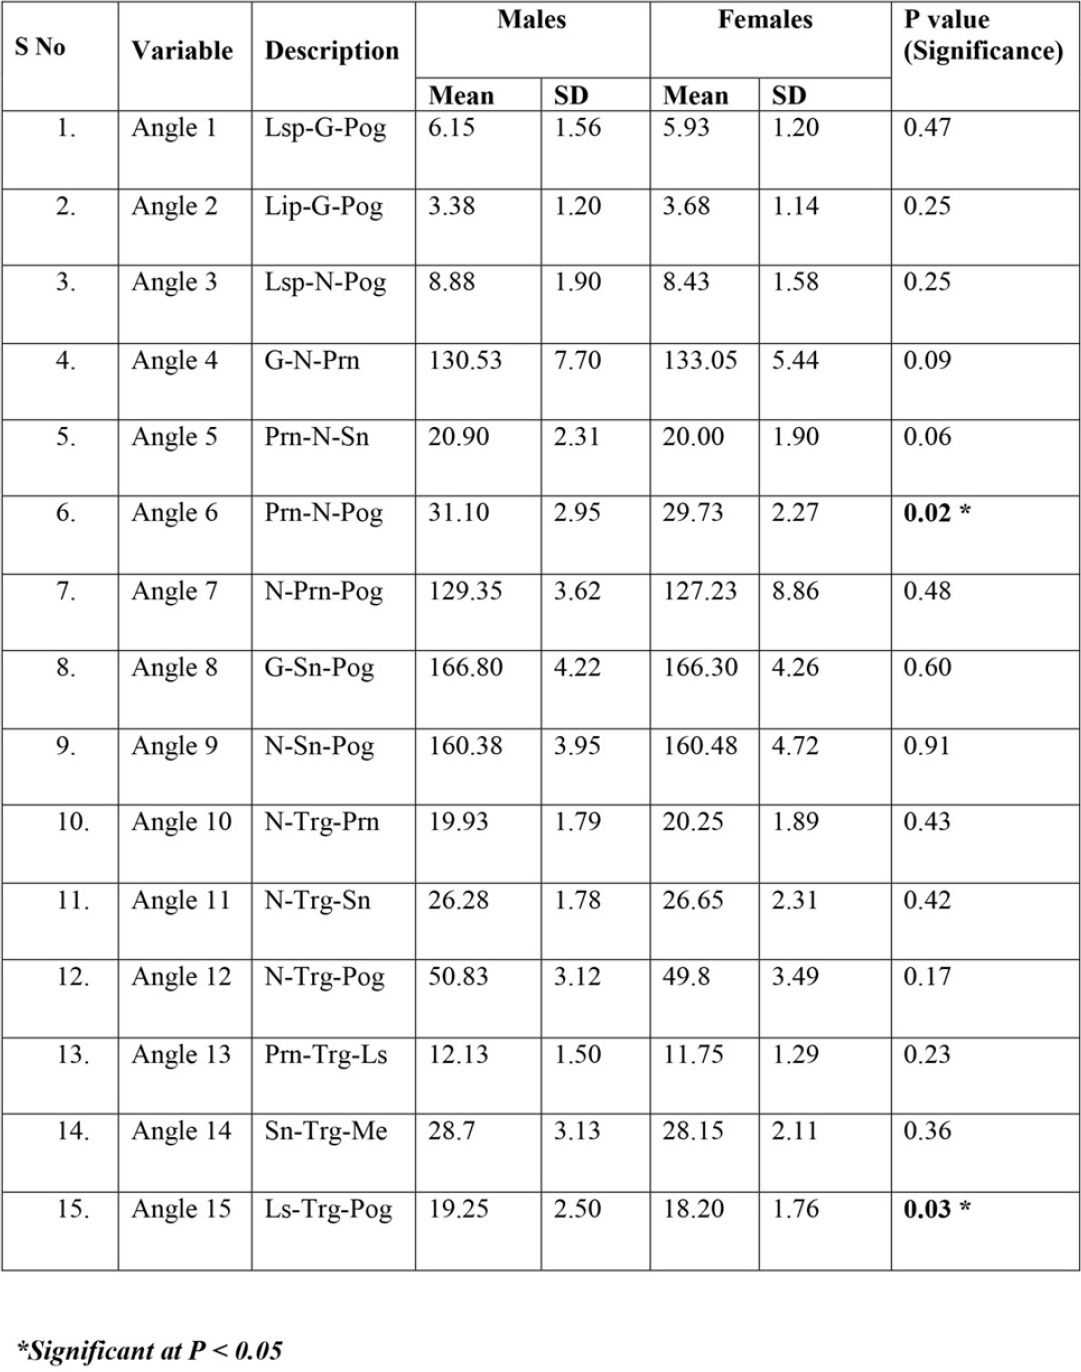
Ten Ratios and 2 Angles showed significantsexual dimorphism (Tables 3 and 4). Tr-N/N-St,ratio between height of forehead and upper face(P=0.00). Tr-N/Sn-Me, ratio between height offorehead and lower face (P=0.00). N-St/Sn-Me, ratiobetween upper face and lower face height (P=0.00).Ls-St/St-Li, Vermilion Height Index (P=0.05). AIR-AIL/ N-Sn, Nasal Index (P=0.01). Sn-St/ChR-ChL,Upper lip length-Mouth width Index (P=0.00). Sn-Me/ChR-ChL, Lower face height- Mouth widthIndex (P=0.00). Sn-Me/XR-XL, Lower face Index(P=0.00). N-St/XR-XL, Upper face Index (P=0.04).N-Me/XR-XL, Facial Index (P=0.00). Pn-S-Pog;Nasal prominence angle (P=0.02), Ls-Trg-Pog:Mandibular angle (P=0.03).
|
Table 3: Frontal photographic Analysis: Comparsion of Males & Females of PRESENT Study
Click here to view |
|
Table 4: Lateral photographic Analysis: Comparsion of Males & Females of PRESENT Study
Click here to view |
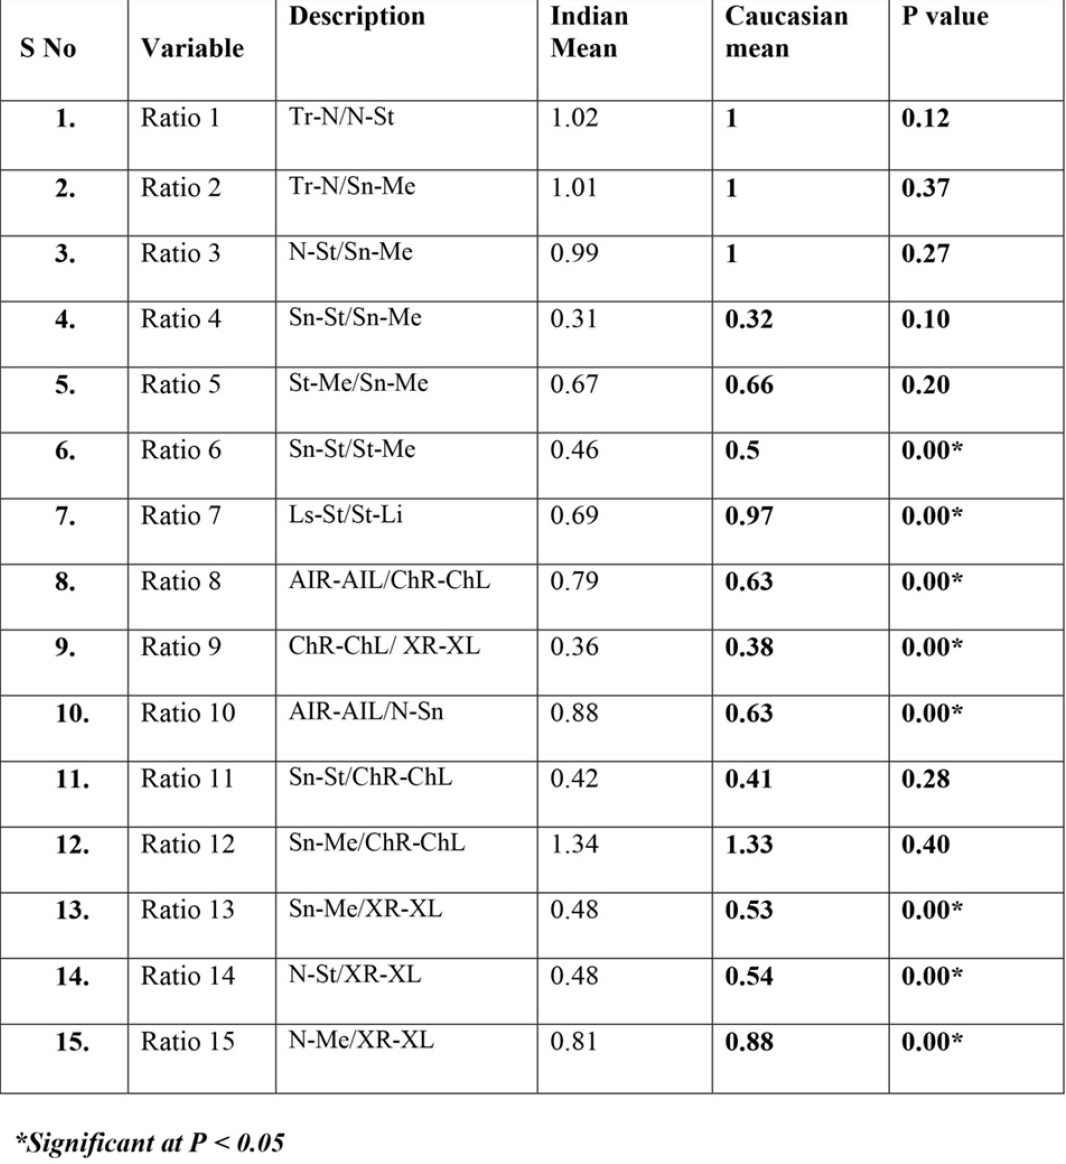
Eight of the 15 investigated ratios on frontalphotographs of males showed significant statisticaldifferences (Table 5). They are Ratio 6: Sn-St/St-Me, ratio between upper and lower lip length(P=0.00), Ratio7: Ls-St/St-Li, Vermilion HeightIndex (P=0.00), Ratio 8: AIR-AIL/ChR-ChL, Nose-Mouth widthIndex (P=0.00), Ratio 9: ChR-ChL/XR-XL, Mouth- face width Index (P=0.00), Ratio10: AIR-AIL/ N-Sn, Nasal Index (P=0.00), Ratio13: Sn-Me/XR-XL, Lower face Index (P=0.00), Ratio 14: N-St/XR-XL, Upper face Index (P=0.00), Ratio 15: N-Me/XR-XL, Facial Index (P=0.00).
|
Table 5: Frontal photographic Analysis: Comparsion of Hyderabad and Caucasian Male Sample
Click here to view |
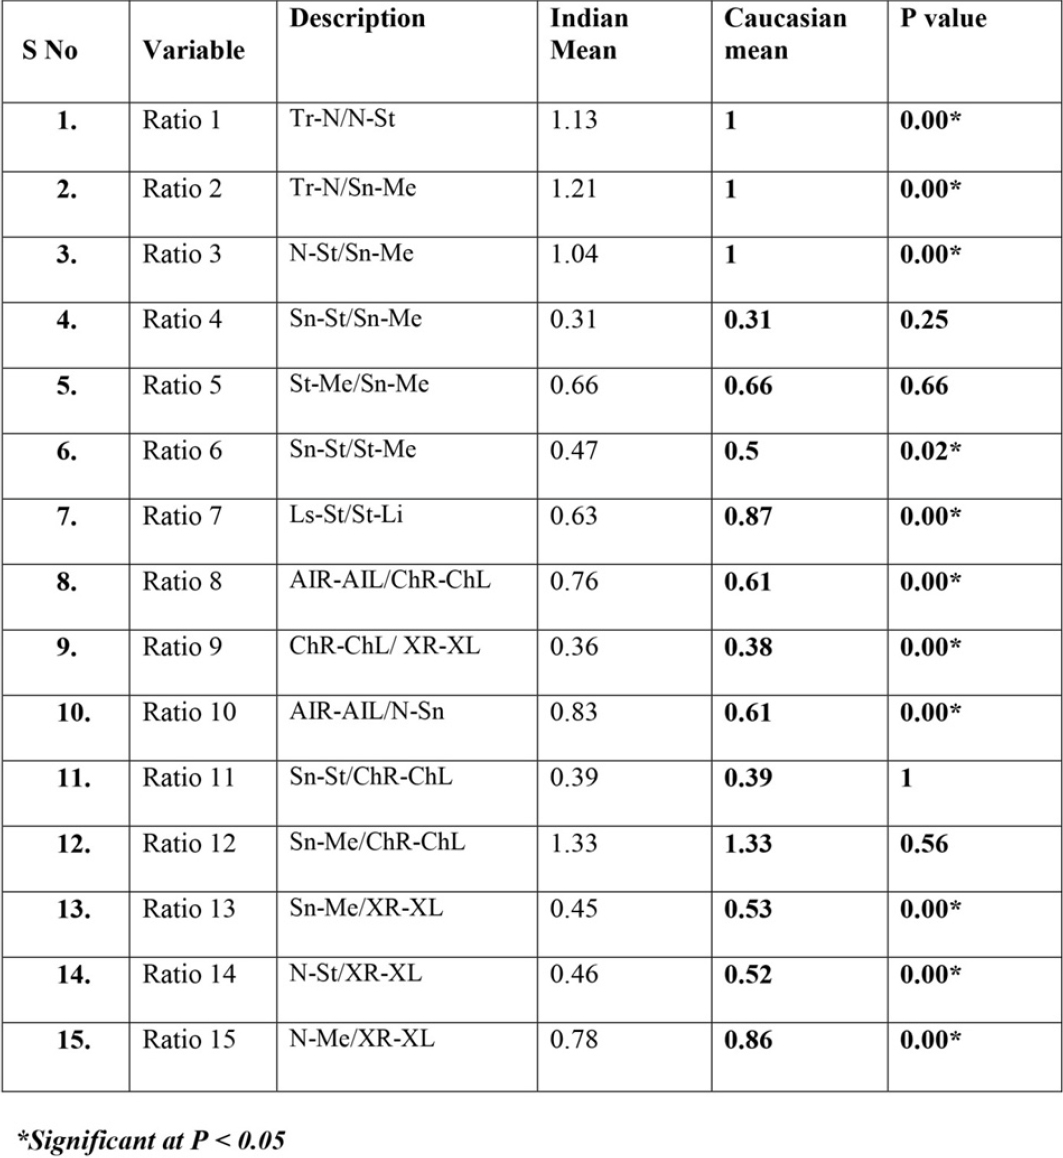
Eleven of the 15 investigated ratios on frontalphotographs of females showed significant statisticaldifferences (Table 6). They were:
|
Table 6: Frontal photographic Analysis: Comparsion of Hyderabad and Caucasian Female Sample
Click here to view |
Ratio 1: Tr-N/N-St, ratio between height offorehead and upper face (P=0.00),
Ratio 2: Tr-N/Sn-Me, ratio between height offorehead and lower face (P=0.00),
Ratio 3: N-St/Sn-Me, ratio between upper face andlower face height (P=0.00), are
Ratio 6: Sn-St/St-Me, ratio between upper andlower lip length (P=0.00),
Ratio 7: Ls-St/St-Li, Vermilion Height Index(P=0.00),
Ratio 8: AIR-AIL/ChR-ChL, Nose-MouthwidthIndex (P=0.00),
Ratio 9: ChR-ChL/XR-XL, Mouth- face widthIndex. (P=0.00),
Ratio 10: AIR-AIL/ N-Sn, Nasal Index (P=0.00),
Ratio 13: Sn-Me/XR-XL, Lower face Index(P=0.00),
Ratio 14: N-St/XR-XL, Upper face Index (P=0.00),
Ratio15: N-Me/XR-XL, Facial Index (P=0.00).
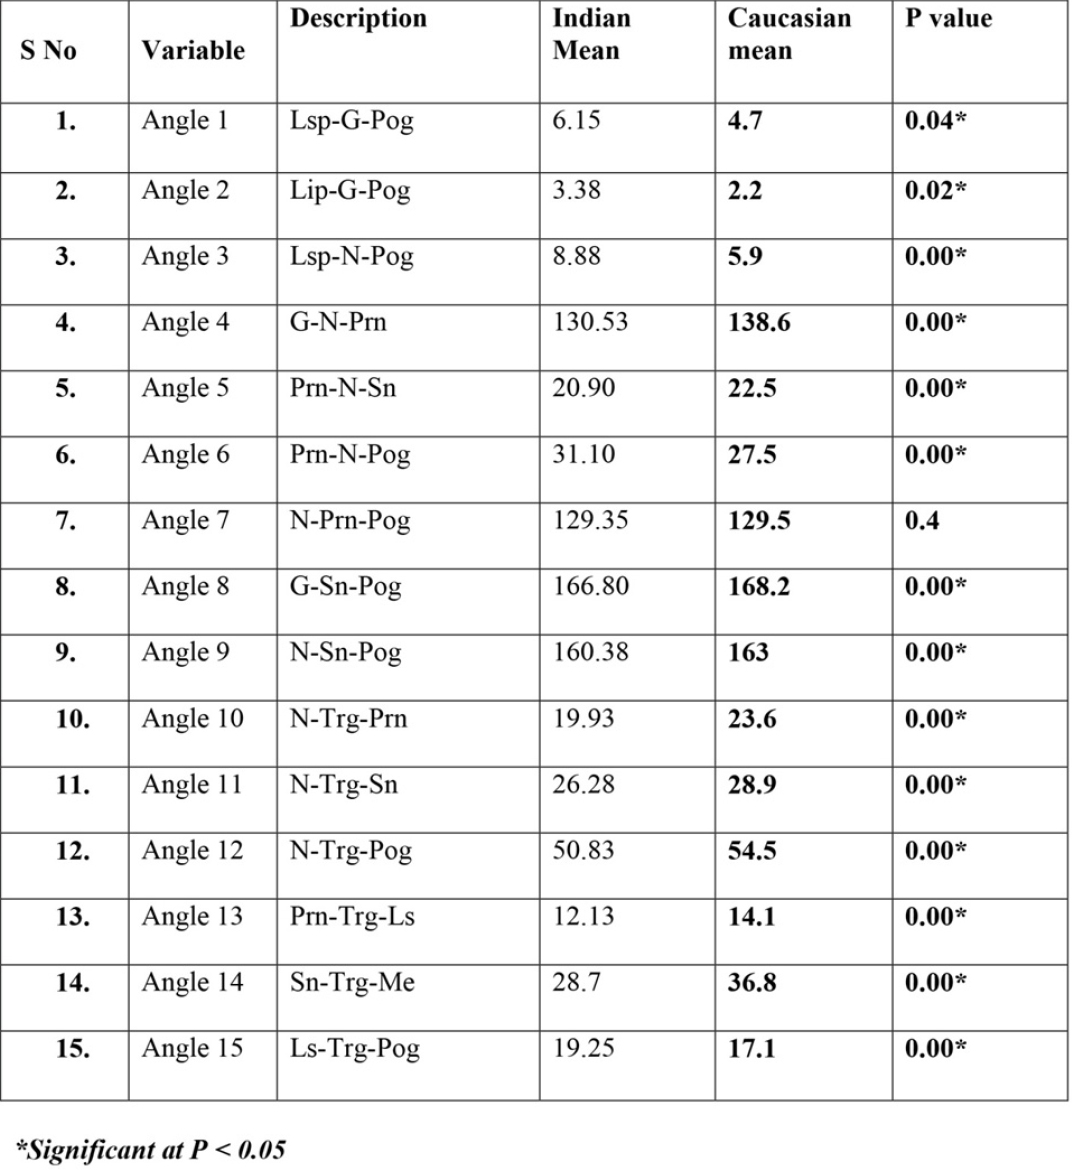
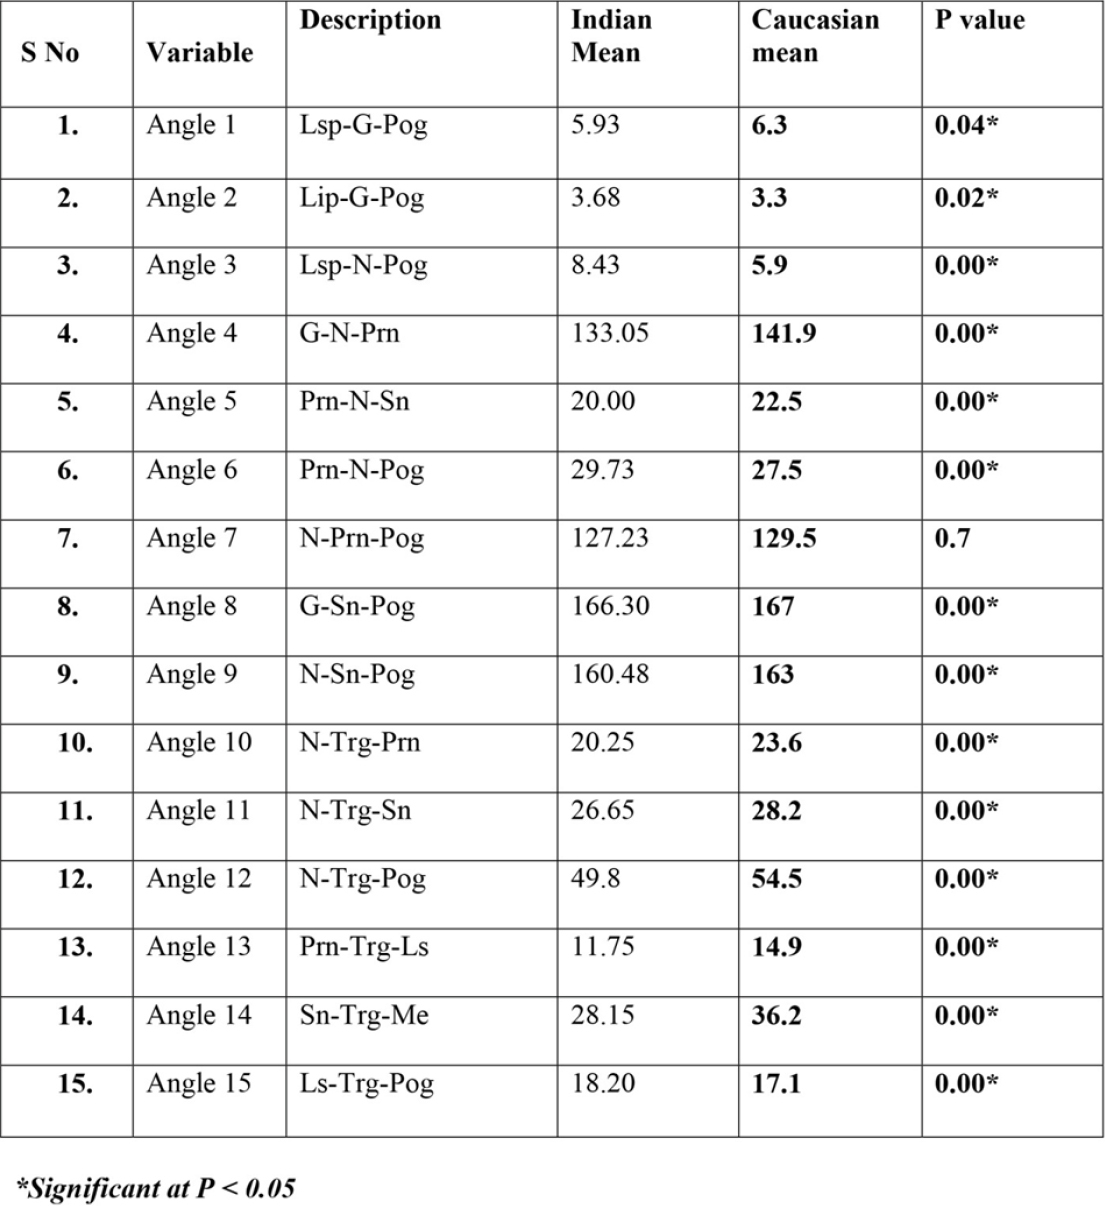
Fourteen of the 15 investigated angles on lateralphotographs showed significant differences betweenHyderabad population and Caucasians (Tables 7 and 8).
|
Table 7: Lateral photographic Analysis: Comparsion of Hyderabad and Caucasian Male Sample
Click here to view |
|
Table 8: Lateral photographic Analysis: Comparsion of Hyderabad and Caucasian Female Sample
Click here to view |
Angle1: Lsp-G-Pog; Upper lip projection (P=0.04),
Angle2: Lip-G-Pog; Lower lip rojection (P=0.02),
Angle 3: Lsp-N-Pog; Maxillofacial angle (P=0.00),
Angle4:G-N-Prn;Nasofrontal angle (P=0.00),
Angle 5: Prn-N-Sn;Columella length angle(P=0.00),
Angle 6: Prn-S-Pog; Nasal prominence angle(P=0.00),
Angle 8: G-Sn-Pog; Angle of facial convexity(P=0.00),
Angle 9: N-Sn-Pog (P=0.00),
Angle 10: N-Trg-Prn; Nasal angle (P=0.00),
Angle 11: N-Trg-Sn; Angle of medium facial third(P=0.00),
Angle 12: N-Trg-Pog; Total vertical angle (P=0.00),
Angle 13: N-Trg-Ls (P=0.00),
Angle 14: Sn-Trg-Me; Angle of inferior facial third(P=0.00),
Angle 15: Ls-Trg-Pog: Mandibular angle (P=0.00)
DISCUSSION
Frontal Photographic Analysis
The first step in analysing facial proportions isto examine the face in frontal view.14 Prior to theadvent of cephalometric radiography, dentists andorthodontists often used anthropometricmeasurements (i.e., measurements made directlyduring the clinical examination) to help establishfacial proportions. Although for orthodontists, thismethod was largely replaced by cephalometricanalysis for many years, the recent emphasis on softtissue proportions has brought soft tissue evaluationback into prominence. Differences in facial types andbody types obviously must be taken into accountwhen facial proportions are assessed, and variationsfrom the average ratios can be compatible with goodfacial aesthetics.
In orthodontics, Ricketts was the first to claimthat the analysis of a physically beautiful face shouldbe approached mathematically.2 He reported thatthree values in attractive faces were approximatelyeven. They were the forehead to the eye, the eye tothe mouth, and the nose to the chin. The studydemonstrated that Hyderabad males (Tr-N/N-St, (Figure 1, colour plate I) males= 1.02±0.09, females=1.13±0.07, P=0.00; Tr-N/Sn-Me, (Figure2, colour plate I) males= 1.01±0.1, females=1.22±0.14, P=0.00; N-St/Sn-Me, (Figure 3, colourplate I)males= 0.99±0.06, females=1.04±0.07, P=0.00.) displayed the same proportions as that of Caucasians but females showed statisticallysignificant differences (Females; Tr-N/N-St, P=0.00;Tr-N/Sn-Me, P=0.00, N-St/Sn-Me, P=0.00). The Hyderabad females displayed a significant increasedratio over the males, possibly due to increased heightof forehead, and greater distance from nasion to stomion. As the top of the forehead is marked bythe variable position of the frontal hairline, whichdiffers greatly between males and females, a large fore head does not necessarily mean that they havea large head overall, sometimes it means thathairline of females is further up their head. The ratiobetween upper lip height and lower face height (Sn-St/Sn-Me, (Figure 4, colour plate I) males=0.31±0.02, females = 0.31±0.02), lower lip height andlower face height (St-Me/ Sn-Me, (Figure 5, colour plate I)males = 0.67±0.04, females = 0.67±0.04) was similar for Hyderabad males and females and nodifference was seen between Hyderabad populationand Caucasians.
|
Click here to view |
|
Click here to view |
|
Click here to view |
|
Click here to view |
Upper to lower lip ratio (Sn-St/St-Me, (Figure6, colour plate I)males= 0.46±0.04, females=0.47±0.05) significantly decreased (P=0.00), indicating increased lower lip length. Arnett andBergman (1993a, b) presented a clinical facialanalysis based on previous studies and their surgicalexperience. 15, 16 According to the authors, the normalratio of upper to lower lip is 1:2 (0.5). Proportionatelips harmonize regardless of length. Vermilionheight Index, (Figure 7, colour plate I) (Ls-St/St-Li, P=0.00) also significantly decreased in ourpopulation, indicating increased lower vermilionheight. Significant sexual dimorphism was alsonoted (Ls-St/St-Li, males= 0.69±0.14, females=0.64±0.1 1, P=0.05). The Hyderabadfemales displayed a decreased ratio over the males, possibly due to lower vermilion height.
Nose-Mouth width Index, (Figure 8, colourplate I) (AIR-AIL/ChR-ChL, males= 0.79±0.05, females = 0.76±0.11) values of males and femaleswere almost the same, and were significantly morethan the Caucasian ratio (AIR-AIL/ChR-ChL, P=0.00) indicating increased width of the alar base. This is in accordance with Sarver’s observation thatthe width of the alar base is heavily influenced byinherited ethnic characteristics. 17 It is veryimportant to be sensitive to the ethnicity of thepatient when variations in nasal proportions arediscussed.
Nasal Index (Figure 10, colour plate II) showed significant sexual dimorphism (AIR-AIL/N-Sn, males= 0.88±0.09, female s= 0.83±0.08, P=0.01). The Hyderabad females displayed a decreased ratioover the males, possibly due to the greater distancefrom nasion to subnasale in females. WhenHyderabad and Caucasian values were compared, the mean difference was significant.
Upper face height -Mouth width Index (Figure11, colour plate II)(Sn-St/ChR-ChL, males=0.42±0.04, females = 0.39±0.05, P=0.00) and Lowerface height- Mouth width index (Figure 12, colourplate II)(Sn-Me/ChR-ChL, males = 1.34±0.10, females = 1.23±0.13, P=0.00) showed significantsexual differences. Females displayed decreasedratio over the males, probably due to decreasedwidth of the mouth when compared to males and nodifference was seen between us and Caucasians. Mouth seems to be wider in men than in women. The Lower face height-Face width Index (Figure13, colour plate II;Sn-Me/XR-XL, males =0.48±0.03, females= 0.45±0.03, P=0.00) and TheUpper face height-Face width Index (Figure 14, colour plate II; N-St/XR-XL, males= 0.48±0.02, females = 0.46±0.03, P=0.04) showed significantsexual differences in our population. Femalesshowed slightly larger lower face height than males. On comparing Hyderabad and Caucasian values, theCaucasian values were significantly greaterindicating that Caucasians have relatively largelower half of the face.
The proportional relationship of facial heightto width (the facial index, Figure 15, colour plateII),more than the absolute value of either, establishoverall facial type and the basic proportions of theface. This measurement relates the verticaldimension of the face to horizontal dimension. Thefacial index (N-Me/XR-XL, males= 0.81±0.03, females = 0.78±0.03, P=0.00) showed significantsexual differences in our population. On comparingIndian and Caucasian values, the Caucasian valueswere significantly greater (N-Me/XR-XL, P=0.00)indicating that the facial index was greater intheCaucasian population. This could be on account ofracial differences.
Lateral Photographic Analysis
Upper Lip Projection (Lsp-G-Pog; (Figure 1, colour plate III);males= 6.15±1.6 degrees, females=5.93±1 .2 degrees) and Lower Lip Projection(Lip-G-Pog; (Figure 2, colour plate III;males=3.38±1.2 degrees, females=3.68±1 .1 degrees.)showed statistically significant differences betweenHyderabad and Caucasian population (Lsp-G-Pog, P = 0.05; Lip-G-Pog, P = 0.04). Both angularmeasurements were significantly more than theCaucasian values. Males showed more inclinationof upper lips from vertical than female populationand females showed more inclination of lower lipsfrom vertical than male population, though notstatistically significant. Maxillofacial angle (Lsp-N-Pog; (Figure 3, colour plate III;males=8.88±1.9degrees, females=8.43±1.6 degrees.) relates theupper lip to chin, horizontally. It may be consideredas soft tissue analog to cephalometric ANBintroduced by Richard Riedel.18 On comparingHyderabad and Caucasian values, the Hyderabadvalues were significantly greater (P=0.00), indicating that the maxillofacial angle was greaterin our population. This could be on account of racialdifferences. Peck and Peck (1970) studiedstandardized cephalometric and photographicrecords of Caucasians with pleasing faces. 3 Themean value obtained for this angle according to thoseauthors was 5.9±1 .7degrees. The range of angleamong 52 subjects was 2.5 to 9.5degrees. Thenasofrontal angle (G-N-Prn; (Figure 4, colourplate III did not show any statistically significantsexual differences (males = 130.5 ± 7.7 degrees, females = 133 ± 5.4 degrees). Fernandez-Riviero, ina study of Angular photogrammetric analysis of thesoft tissue facial profile of young adult EuropeanCaucasian population showed statisticallysignificant sexual differences (P < 0.01) (males = 138± 7 degrees, females = 142 ± 6 degrees). Epker(1992)6, in a study of Caucasians undertaken onfrontal and lateral facial views, observed no sexualdifferences in this angle (130 degrees). 10 Nasalprominence relative to chin angle (Prn-N-Sn, Figure 5, colour plate III, males = 20.90 ± 2.3degrees, females = 20 ±1.9 degrees) values weresimilar for Hyderabad males and females, but theywere significantly less than the Caucasian values(P=0.00). Jacques Joseph, the German father ofrhinoplasty, studied modern and ancient works ofart and stated that the range for esthetic nasalprominence was 23 to 37 degrees and that the idealwas 30 degrees.5 Clements noted that in most greatworks of art the nasal prominence averaged 30degrees or less. Columellar length angle showedsignificant sexual differences (Prn-N-Pog, Figure6, colour plate III; males = 31.1 ± 2.9 degrees, females = 29.7 ±2.3 degrees, P=0.02) . Our populationshowed significantly larger columellar lengths thanCaucasians. Lines PA, Lines RR, and Lines CA(1978) did a study to compare the facial profilecomponents considered desirable for males to thoseof females and found that the Nasal prominencerelative to chin angle was 22.5 degrees with a rangeof 20 to 35 degrees and columellar length angle 27.5degrees.5 Hyderabad population exhibited moreconvex profiles, as indicated by the increased facialconvexity angle G-Sn-Pg, (Figure 8, colour plateIII) as well as increased N-Sn-Pog angle (Figure colour plate IV). Hyderabad females had moreconvex profiles as compared to males, but thedifference was not significant. According to theauthors, a Class I profile presented an angle rangeof 165-175 degrees, a Class II profile less than 165degrees, and a Class III greater than 175 degrees. Yuen and Hiranaka (1989) reported from their Asianadolescent sample on photographic records a G-Sn-Pg angle of 162 ± 5 degrees in females and 161 ± 6degrees in males.19 The G-Prn-Pg angle was 135 ± 4degrees in males and 135 ± 3 degrees in females. Nosexual dimorphism was found. In the presentinvestigation, the facial convexity and total facialconvexity angles obtained were similar. G-Sn-Pg:166.80 ± 4.2 degrees in males and 166.3 ± 4.2 degreesin females.
Peck and Peck (1970) used a profilometricanalysis based on standardized cephalograms andphotographs to assess the soft tissue facial profile.3They analyzed vertical height by means of anglessuch as the total vertical (N-Trg-Pog, Figure 12, colour plate IV), the nasal (N-Trg- Prn, Figure colour plate IV),the maxillary (Prn-Trg-Ls, Figure 13, colourplate IV),and the mandibular(Ls-Trg-Pog, Figure 15, colour plate IV)angles. The values were approximately similar for malesand females in the Hyderabad population for acomposite angle representing the total verticaldimension from nasion to pogonion( N-Trg-Pog, males=50.83 ± 3.1 degrees, females = 49.80 ±3.5degrees). On comparing Hyderabad and Caucasianvalues, the Caucasian values were significantlygreater, the total vertical angle had a mean valueof 54.5 with a range of 47 to 62. The nasal angle (N-Trg-Prn) which measures the nasal height fromnasion to pronasale demonstrated that Hyderabadmales and females had the same nasal angle(males=19.93 ± 1.8 degrees, females = 20.25±1.9degrees), which was significantly less than that ofthe Caucasians. The mandibular angle showedsignificant sexual differences and was significantlymore than Caucasian population.
In this investigation the middle and inferiorfacial thirds were evaluated by the N-Trg-Sn(Figure 11, colour plate IV)and Sn-Trg-Gn(Figure 14, colour plate IV) angles respectively. The inferior third was larger (28.4±2.7 degrees) thanthe middle third (26.5±2 degrees). No sexualdimorphism was seen. The Hyderabad values weresignificantly less than the Caucasian values.
CONCLUSION
The results of this study pointed to the following conclusions:
As compared to the Caucasians, Hyderabadpopulation has a decreased facial Index. Femalesshowed slightly larger lower face than males. Thenasal dimensions are increased transversely andreduced vertically in our population when comparedto Caucasians. Hyderabad population have adecreased upper lip length to lower lip length ratio, indicating a relatively short upper lip and long lowerlip. Males showed more inclination of upper lip thanfemales. Females showed more inclination of lowerlip than males. Mouth seems to be wider in malesthan in females. Males and females of our populationshowed fuller profile and lips as compared to theCaucasian population.
Many values of our population indices did notshow any correlations with the values of previouslyestablished other population indices. In conclusion, we recommend the utilization of Hyderabad normsduring clinical examination to avoid makinginaccurate diagnostic and treatment plan decisions. At the same time, one needs to acknowledge, asstated by McNamara and Ellis, that “… infinitecombinations of dentoskeletal and soft tissuerelationships are possible to arrive at a face that iswell balanced.”